Data Window displays values for different parameters of a symbol in charts. Thus data window makes charts readable. You can personalize the background color of data window for charts.
To change Data Window color:
1. Go to menu ‘Customize’
2. Select submenu ‘Data Window’
3. Select option ‘Data Window Color’

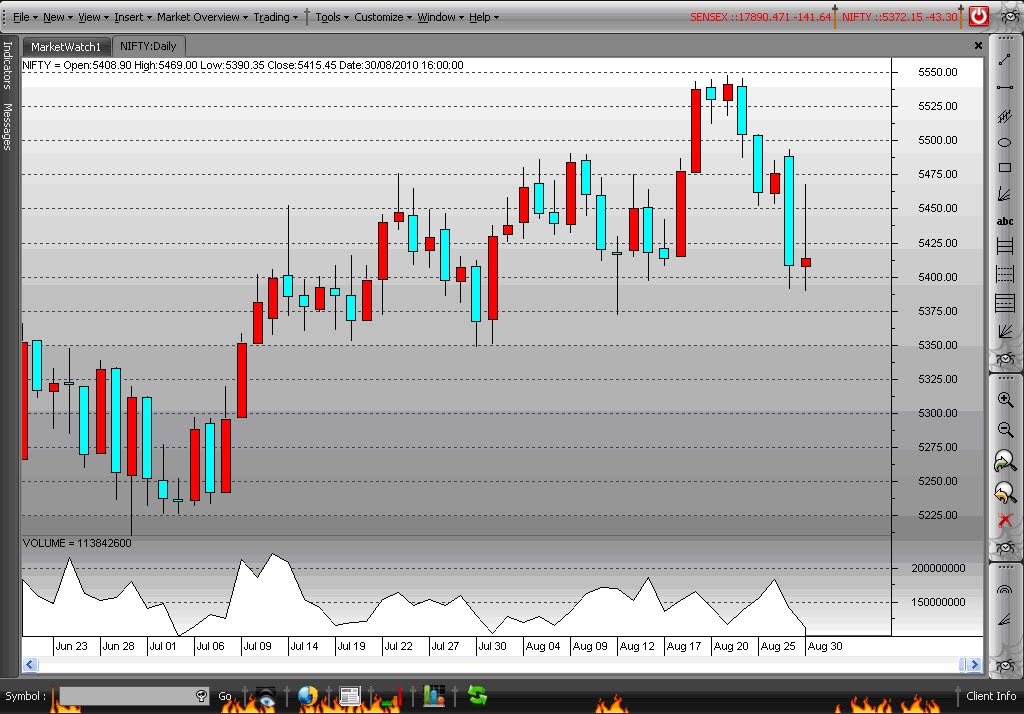
Image.1

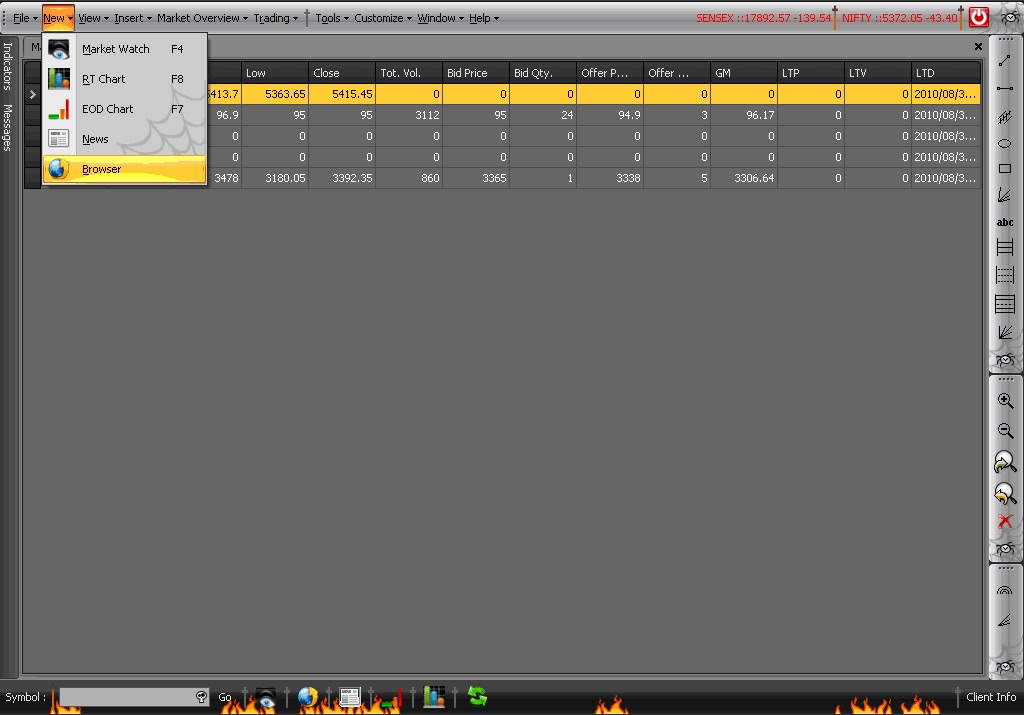
Image.2

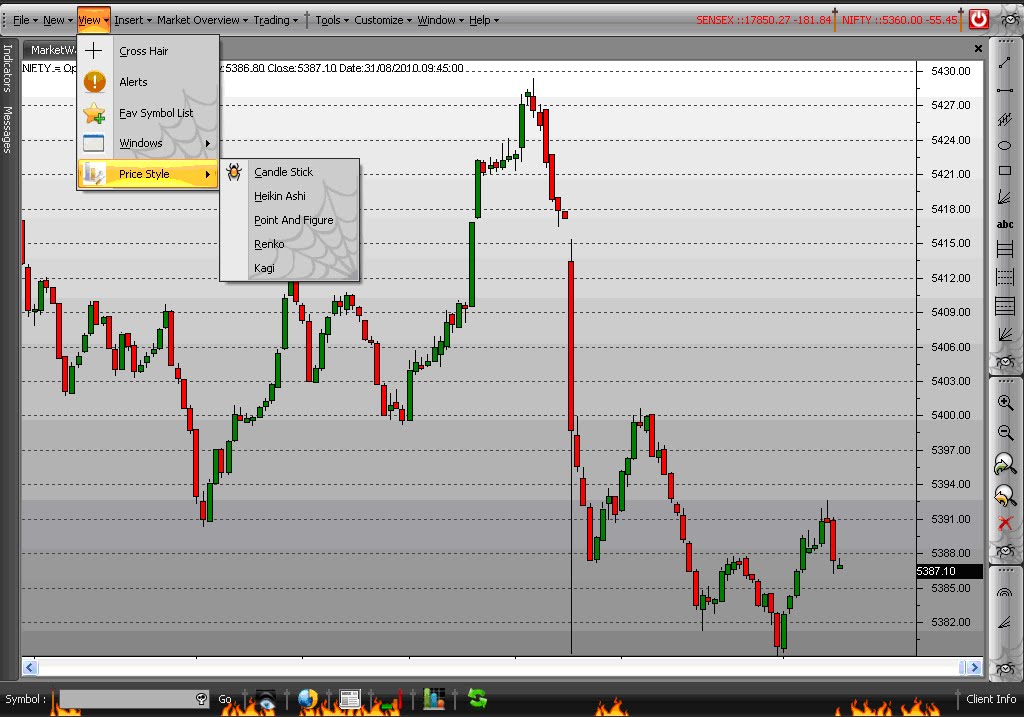
Image.3